Why Project Status Reports Lie Even When Everyone Is Honest
Most delivery reports fail because they summarize intention, not evidence. This article explains how to read project reality from work signals instead of optimistic updates.
Practical essays on software delivery, project execution, and engineering leadership.
Most delivery reports fail because they summarize intention, not evidence. This article explains how to read project reality from work signals instead of optimistic updates.
Most engineering metrics don’t predict delivery risk. This guide explains which metrics actually matter, how to read them, and why vanity metrics like velocity often mislead teams.
Delivery risk often begins before the first commit. Learn the planning mistakes that make teams look busy but move slowly.
Agile status updates often create a false sense of progress. This article explains why phrases like ‘on track’ hide delivery risk and how to replace them with real execution signals.
Most AI project management tools just summarize the same broken data. Real execution intelligence requires agents that detect patterns, not LLMs that hallucinate.
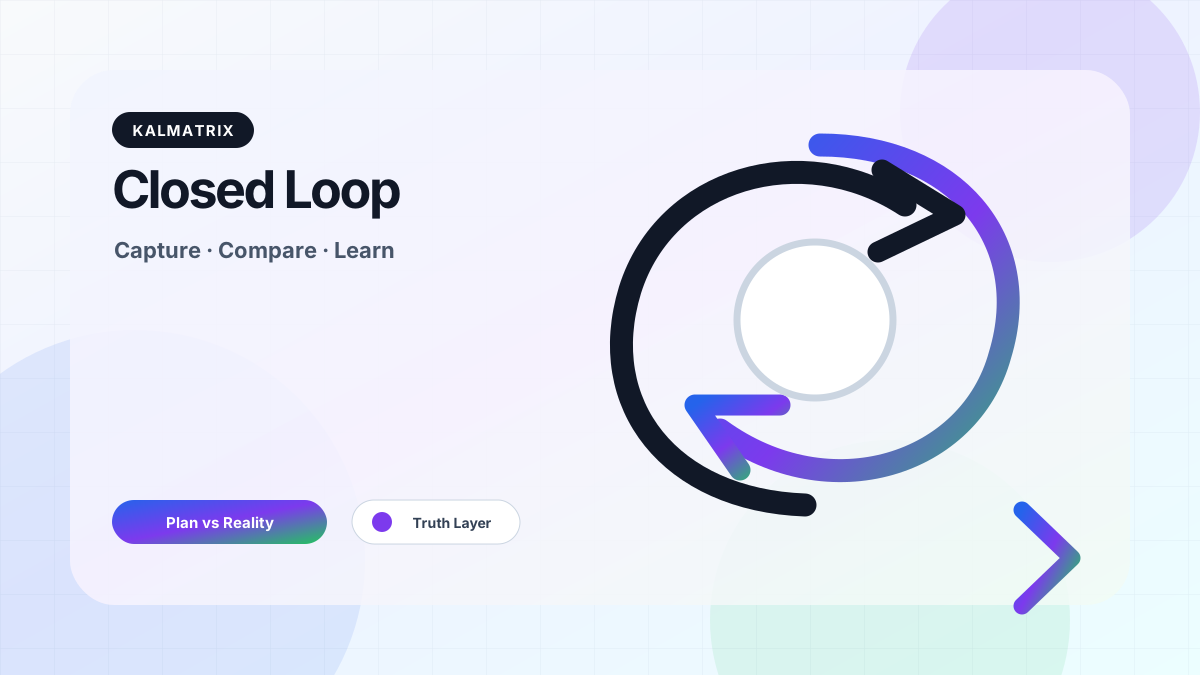
Most software teams operate in open loops where plans are not validated against reality. This guide explains closed-loop execution systems and how they prevent delivery failures.
Most delivery risks are visible early through small signals like PR delays, inactivity, and hidden scope changes. This guide explains the signals teams ignore and how to act on them.
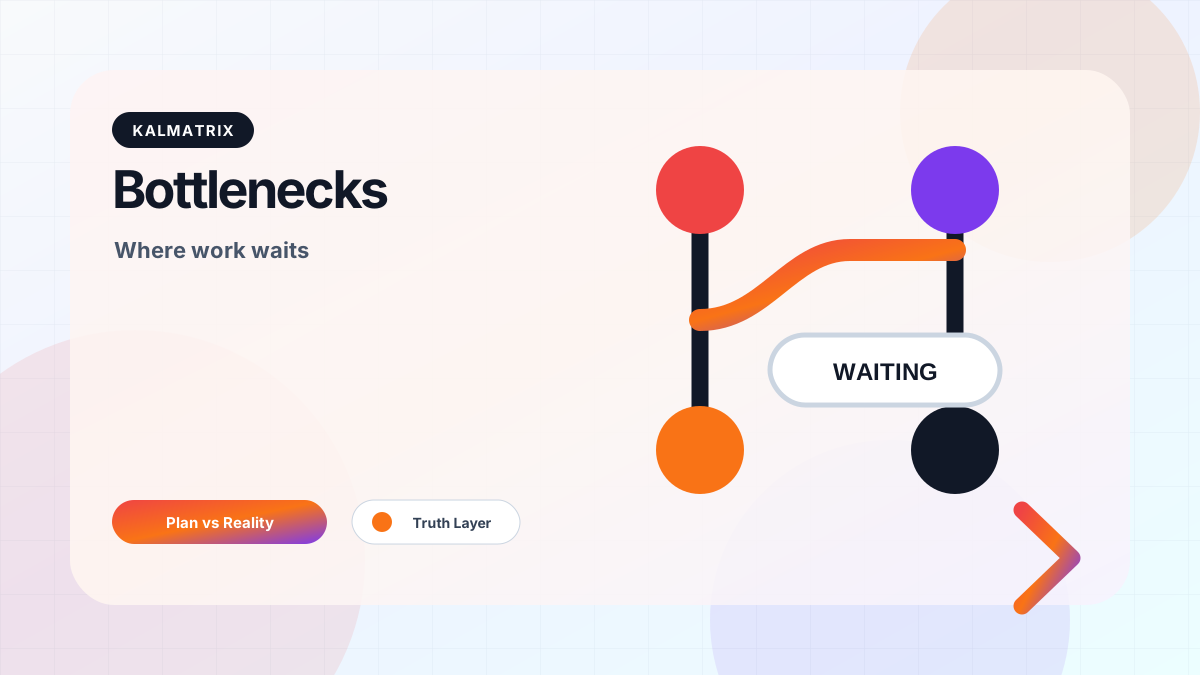
Engineering bottlenecks slow down delivery long before deadlines are missed. This guide explains how to detect bottlenecks early using real execution signals like PR delays, review queues, and inactivity.
Most engineering dashboards look clean but hide real execution problems. This guide explains why dashboards fail to show true progress and how to detect real delivery signals.
Many software projects appear ‘green’ until they suddenly fail. This guide explains false green project status, why it happens, and how to detect hidden delivery risk early.
Engineering management is shifting from manual reporting to AI-driven execution intelligence. This article explains how AI agents will replace dashboards, reports, and status updates.
Most teams think Jira is their source of truth, but real execution lives elsewhere. This guide explains how to build a true single source of truth using execution signals across tools.
Most teams rely on status updates for visibility, but real insight comes from execution signals. This guide explains how to build real-time project visibility using code, PRs, and communication data.
Most software delays are visible days or weeks before deadlines are missed. This guide explains how to detect delivery risk early using real execution signals instead of status updates.
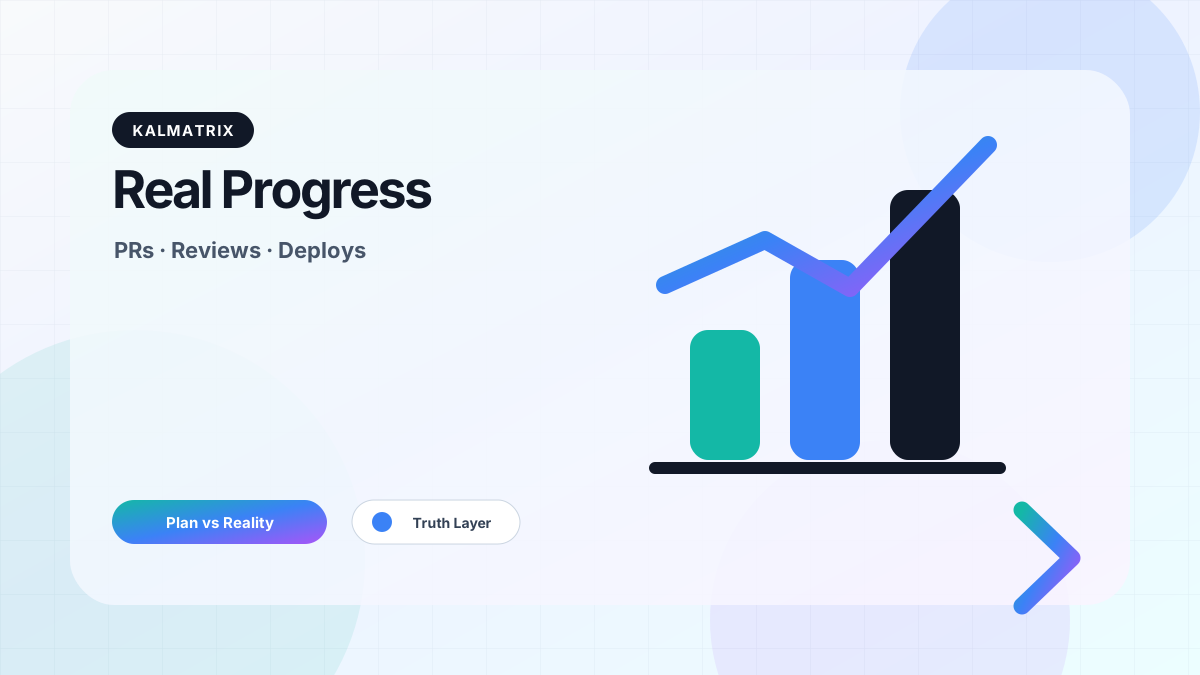
Most teams track activity instead of real progress. This guide explains how to measure true software development progress using execution signals like PRs, reviews, and deployments instead of Jira movement.
Most blockers are known before they are reported. This guide explains how to identify blockers in software projects using execution signals like PR delays, inactivity, and dependency gaps instead of relying only on standups.
Linear, Asana, and ClickUp won’t fix your visibility problem. The issue isn’t Jira—it’s that planning tools can’t see execution. Learn what you actually need to track real delivery.
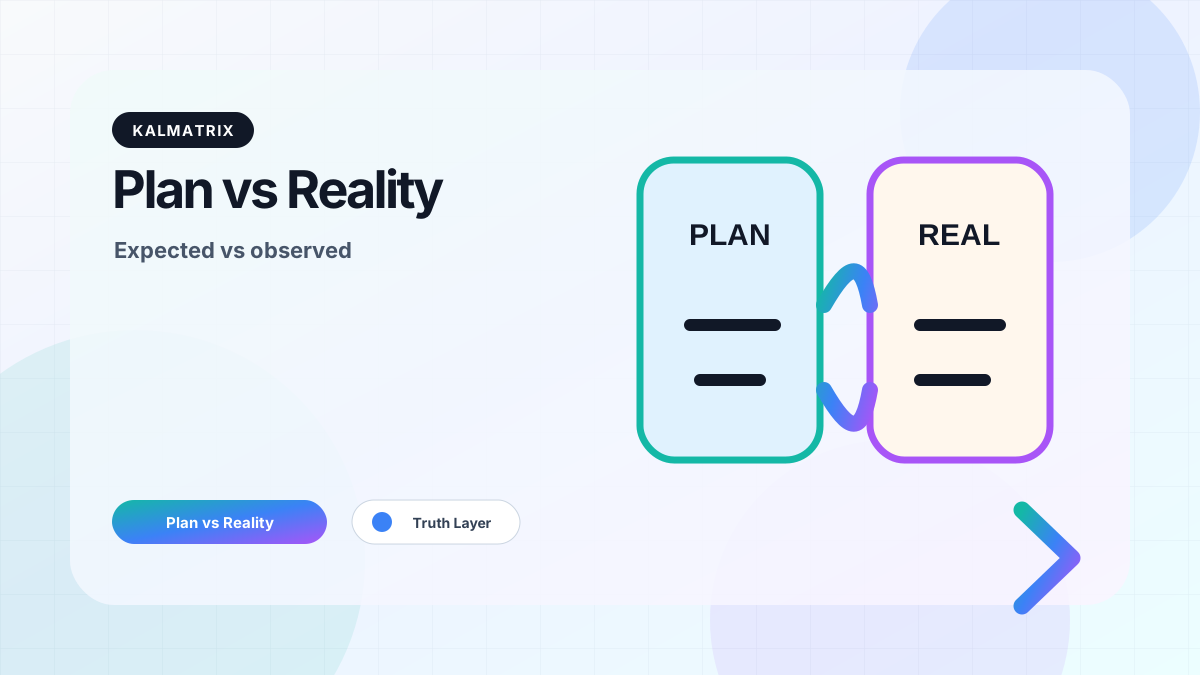
Software projects don’t fail because of bad plans. They fail because reality diverges from the plan and no one notices early. This guide explains the plan vs reality gap and how to detect it.
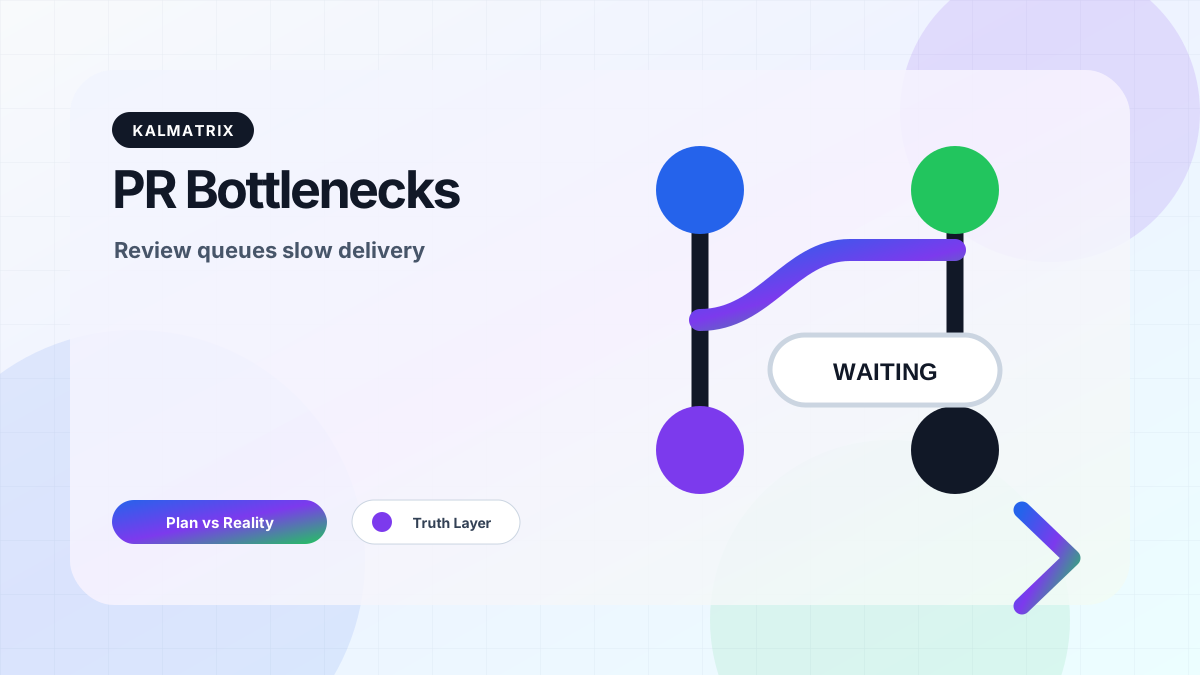
Pull request delays are one of the biggest hidden causes of software delivery slowdowns. This guide explains how code review bottlenecks impact timelines and how to detect and fix them early.
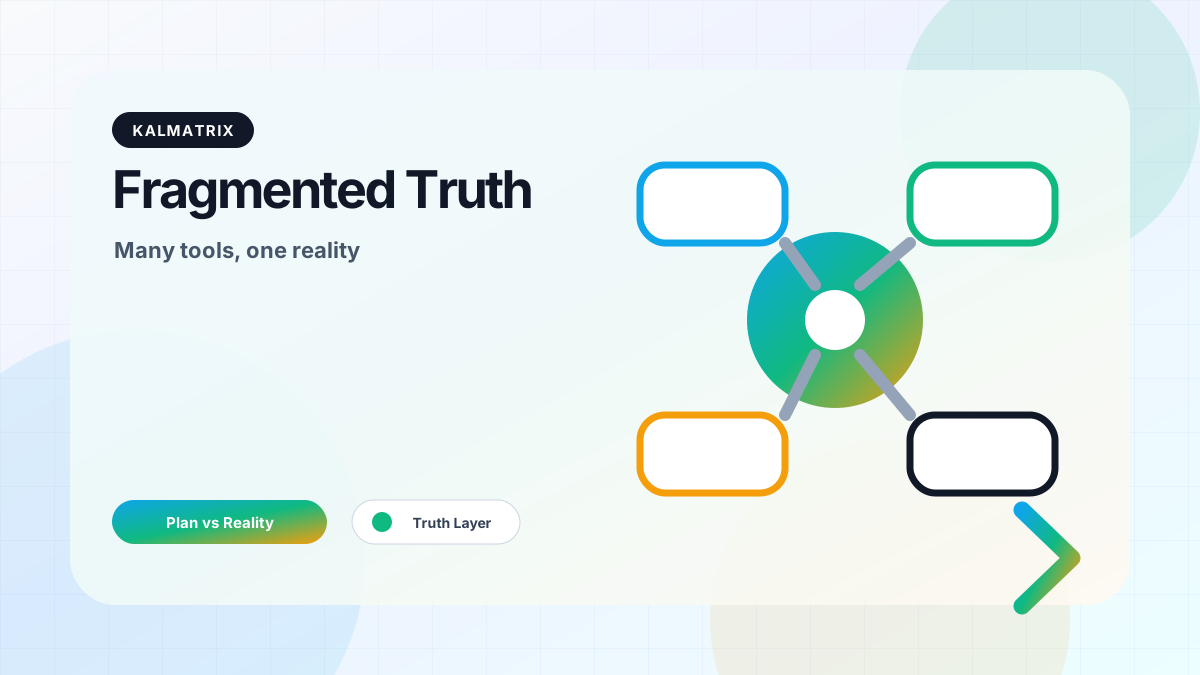
Most engineering teams think they have a single source of truth, but information is fragmented across Jira, Git, and Slack. This article explains why that breaks delivery and how to fix it.
Untracked work and scope creep quietly expand project timelines without visibility. This guide explains how they happen, why they go unnoticed, and how to detect them early.
CTOs don’t need more dashboards or reports. They need real-time execution visibility. This article explains what that means and how to achieve it in modern engineering teams.
Project reports often show progress that doesn’t exist. This guide explains why reporting drifts from reality and how to align reports with real execution signals.
Software project failure rarely comes from lack of effort. It comes from broken visibility. This guide explains why projects fail even when Jira looks healthy and how to detect real delivery risk early.
Sprint planning often looks structured but fails in execution. This article explains why sprint plans break down, how scope drift happens, and how to reduce delivery risk early.
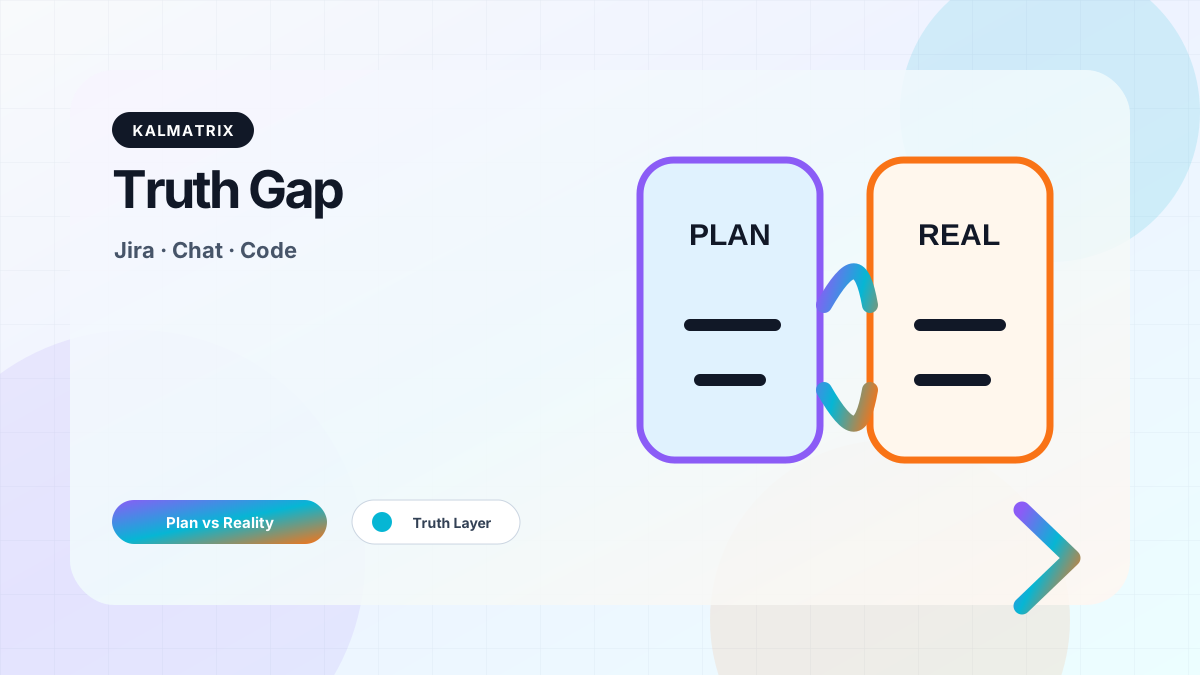
Standups, Jira boards, and Slack channels create the illusion of visibility, but they rarely show what is actually happening. This article explains why these tools fail to reveal project truth and how to detect real execution signals.
Missed deadlines are rarely caused by lack of effort. They come from hidden blockers, scope drift, and invisible delays. This guide explains why teams miss deadlines and how to detect the real causes early.